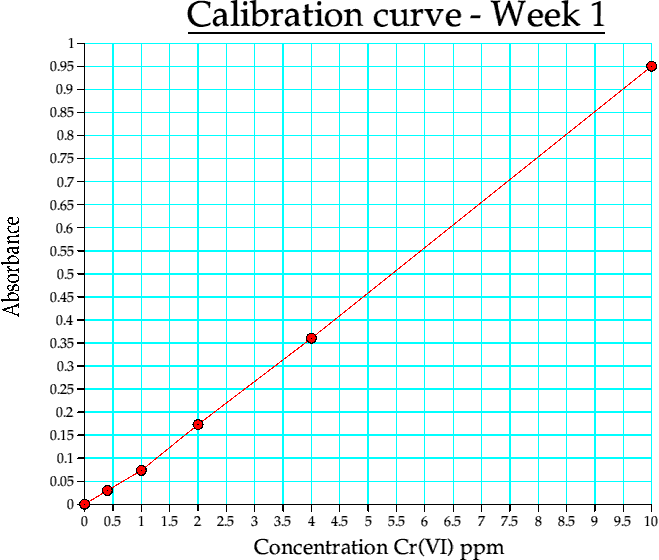
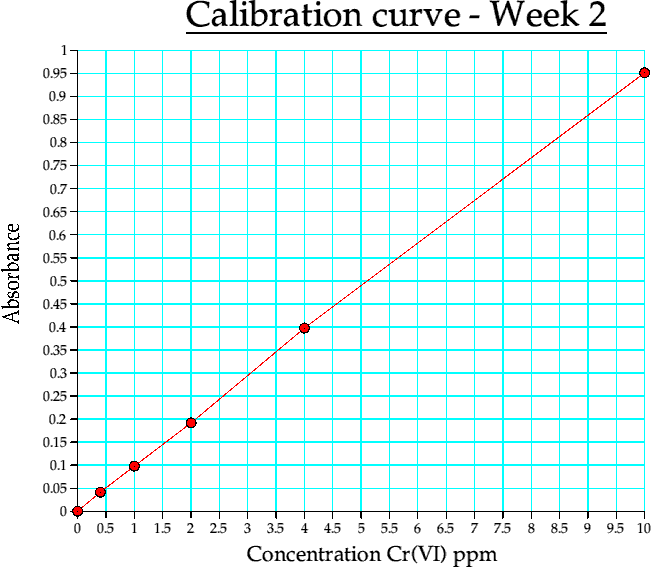
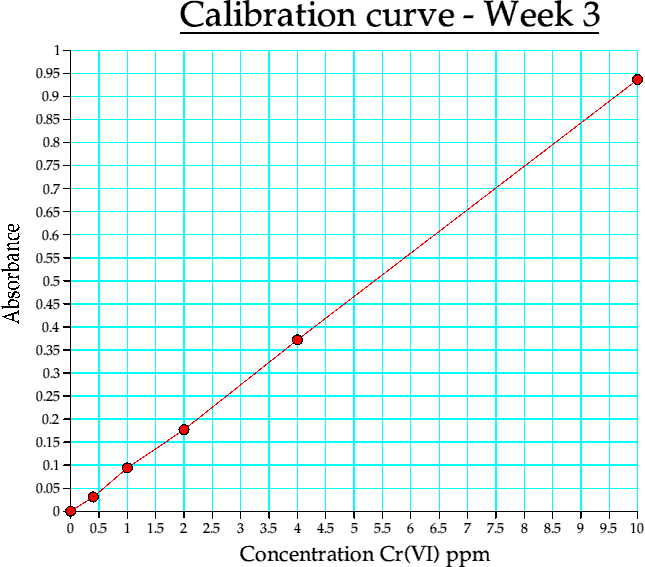
A further graph (the original from LJMU instrumentation) is in the appendices. The calibration graphs are on the following pages.

Graph 1. Calibration curve from week 1

Graph 2. Calibration curve from week 2

Graph 3. Calibration curve from week 3
4.i : The solutions.
All of the solutions were made up as in the revised method sheet before the practical commenced. The DiPC was originally stored in a volumetric flask, but being light sensitive, this had to be disposed of after a few hours. The next DiPC solution was stored in an amber bottle and in a cupboard when not in use.
The solutions were the same for the entire run of practicals to ensure reproducibility of results (except for the DiPC used. This was fresh each time. Any variation would be shown in the calibration curves.)
4.ii : Calibration curve from the standards.
As this practical has been carried out over a number of practical sessions, there are 3 calibration curves. These will be denoted as (i), (ii) and (iii).
(i) This was really just a test run to ensure that the practical was fine, the instrumentation was working and that the basic theory obeyed the Beer law.
(ii) The main one. Using this calibration curve, the interfering ions were assessed and the water samples tested.
(iii) This was performed at LJMU using a bottled water as the test subject. It was carried out on a different machine to the above.
The graphs for (i) and (ii) are absorbance vs. concn (in ppm).
4.iii : The water samples - collection points
The water samples were collected from five parts of Haydock, St. Helens, one from the mains water tap, one from the water still at the University of Salford, LJMU tap water and deionised water and finally a bottled water (commercially available).
The four types were : (1) Rain water pond.
(2) Fishing lake.
(3) Sewerage outlet.
(4) Brook.
| Conc | Abs |
| 0 | 0 |
| 0.400000 | 0.029800 |
| 1 | 0.073350 |
| 2 | 0.172960 |
| 4 | 0.360260 |
| 10 | 0.950740 |
Table 4a. Calibration curve data, week 1
| Conc | Abs |
| 0 | 0 |
| 0.400000 | 0.041390 |
| 1 | 0.097890 |
| 2 | 0.191600 |
| 4 | 0.397510 |
| 10 | 0.951790 |
Table 4b. Calibration curve data. week 2
| Conc | Abs |
| 0 | 0 |
| 0.400000 | 0.031000 |
| 1 | 0.094000 |
| 2 | 0.177000 |
| 4 | 0.372000 |
| 10 | 0.937000 |
Table 4c. Calibration curve data, week 3. (reduction in accuracy)
| Metal ion | Absorbance |
| Co2+ | -0.08858 |
| Hg2+ | -0.06404 |
| Fe2+ | -0.09653 |
| Fe3+ | -0.09653 |
| Ba2+ | -0.07724 |
| Cr3+ | -0.07063 |
Table 5. Interference from other ions.
| Sample | Absorbance | Location | Conc. ppm |
| 1 | 0.08978 | Rain water pond | 0.095 |
| 2 | 0.05449 | Fishing lake | 0.068 |
| 3 | 0.01073 | Sewerage outlet | 0.021 |
| 4 | 0.21443 | Brook | Unknown |
| 5 | 0.00611 | Phys Chem tap | Too low |
| 6 | 0.004 | Bottled water | 0.5 |
| 7 | 0.152 | Tap, LJMU | Unknown |
| 8 | 0.000 | Deionised water | 0.0 |
Table 6. Water sample absorbance values.
| Result number | Absorbance |
| 1 | 0.062 |
| 2 | 0.86105 |
Table 7. Reduction by ascorbic acid.
4.ix : Graphs
A further graph (the original from LJMU instrumentation) is in the appendices. The calibration graphs are on the following pages.
Graph 1. Calibration curve from week 1
Graph 2. Calibration curve from week 2
Graph 3. Calibration curve from week 3


